Correlating Payout Frequencies with Reel Configurations in Modern Video Slot Architectures
Written by Paul Franke · May 30, 2026
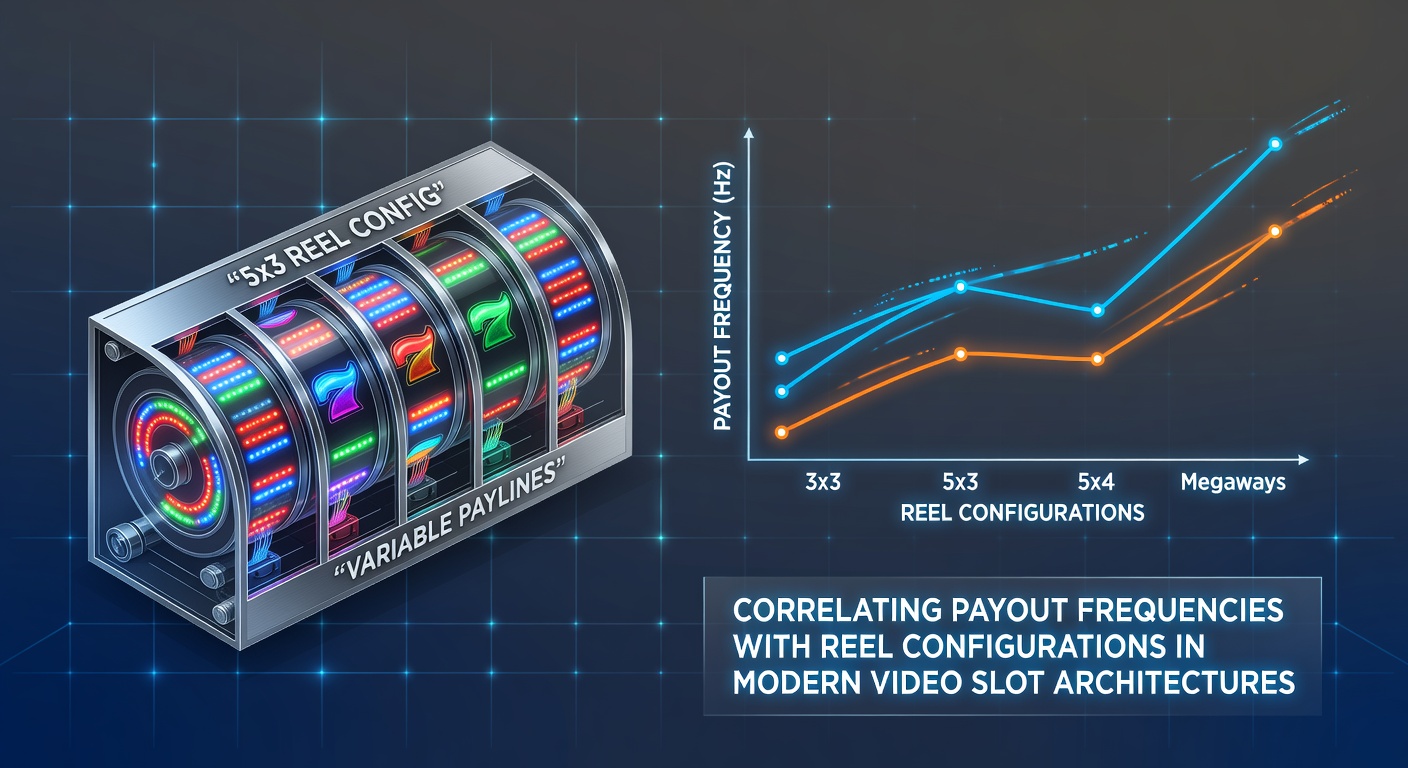
Correlating Payout Frequencies with Reel Configurations in Modern Video Slot Architectures
Modern video slots operate through intricate reel setups that directly shape how often payouts occur, and analysts track these patterns across thousands of game titles released each year. Reel configurations determine the total number of symbol positions available on each reel, while payout frequency depends on how those positions align with paylines or ways-to-win systems. Data collected from gaming laboratories shows clear statistical relationships between the number of reels, the distribution of high-value symbols, and the resulting hit rates measured during certification testing.Reel Architectures and Their Core Components
Five-reel formats dominate current releases, yet three-reel and six-reel variants continue to appear in specific markets. Each reel carries a programmed strip of symbols whose length and weighting control both the theoretical return to player and the frequency of winning combinations. Virtual reel mapping further expands the physical stops into larger virtual sets, allowing developers to fine-tune probabilities without altering visible reel artwork. According to testing data published by the Nevada Gaming Control Board, machines with longer virtual reels exhibit measurable drops in base-game hit frequency when high-paying symbols receive heavier weighting.
Multi-reel engines using the ways-to-win model replace traditional paylines with adjacent symbol matching across reels. This shift changes payout frequency calculations because every possible left-to-right combination counts as a separate win opportunity. Industry reports indicate that a 243-ways configuration on five reels typically produces higher hit rates than a 20-payline setup on the same reel length, provided symbol weights remain constant.
Measuring Payout Frequency Against Reel Variables
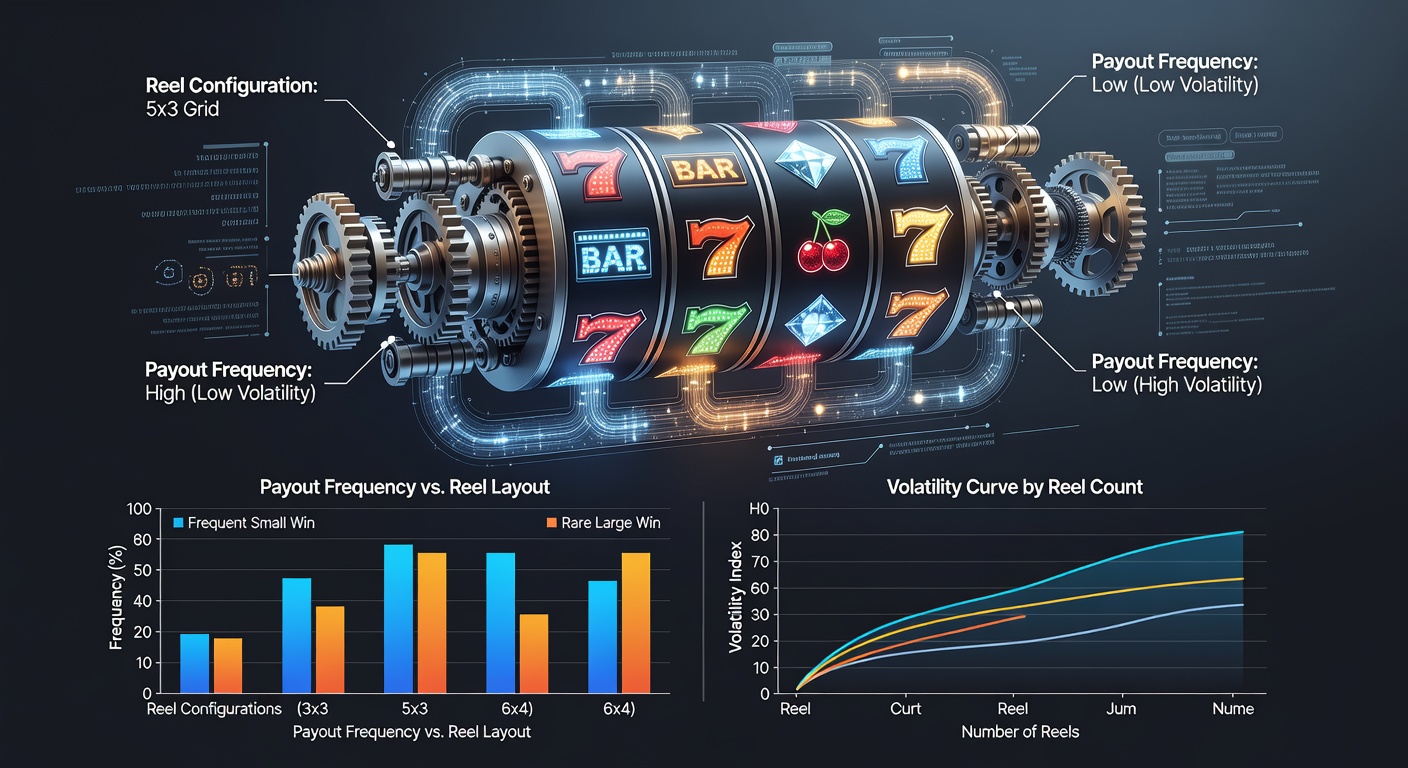
Hit frequency, expressed as a percentage of spins that return any credit award, serves as the primary metric for correlation studies. Researchers compare this figure against reel parameters such as total stops per reel, number of bonus symbols, and the presence of stacked or expanding icons. A study released by the University of Nevada, Las Vegas gaming research unit in early 2025 documented that adding one additional stop to each reel in a five-reel game reduced average hit frequency by roughly 1.8 percentage points when all other variables stayed fixed.
Bonus trigger rates follow similar patterns. Scatter symbols placed on reels two through five produce different activation frequencies depending on whether those reels use identical or staggered symbol counts. Machines that employ staggered reel lengths, where the middle reels contain more stops than the outer ones, demonstrate more consistent bonus intervals across large sample sizes.
Technological Factors Influencing Correlations
Random number generators sample from pools that correspond exactly to the configured reel strips. Any adjustment to reel length or symbol weighting requires fresh RNG certification to maintain statistical integrity. As of May 2026, several European testing houses updated their validation protocols to include automated correlation mapping between reel data files and live payout logs, allowing faster identification of deviations during field trials.
Weighted symbols create non-linear effects on frequency. When a single high-value symbol occupies multiple virtual stops on one reel but only one stop on adjacent reels, the probability of forming five-of-a-kind combinations drops sharply. Regulatory filings from the Alcohol and Gaming Commission of Ontario illustrate how these weighting choices produce payout distributions that cluster around lower-value line hits rather than full-screen combinations.
Practical Examples from Certified Titles
One widely deployed five-reel title with 40 paylines uses 120 virtual stops per reel and places three bonus symbols on each of the first three reels. Certification records show this setup delivers a base-game hit frequency of 28.4 percent and a bonus trigger every 184 spins on average. A comparable title employing 256 virtual stops per reel with the same symbol counts records a hit frequency of 24.9 percent and a bonus interval of 217 spins, confirming the direct impact of reel length on frequency metrics.
Developers sometimes introduce reel cascades or tumbling mechanics that reuse the same configuration across multiple evaluation cycles within one spin. These features extend the effective payout window without changing the underlying reel strips, resulting in higher overall hit rates per paid spin while preserving the original symbol distribution.
Conclusion
Reel configuration remains the foundational variable that governs payout frequency in video slot design. Precise mapping of virtual stops, symbol weights, and evaluation methods allows laboratories and operators to predict hit rates before games reach the floor. Ongoing refinements in testing protocols continue to strengthen the accuracy of these correlations across different regulatory jurisdictions.